For this assignment, I analysed the data concerning the Refugee Population Statistics by the United Nations High Commissioner for Refugees (UNHCR). The database that I researched contains information about forcibly displaced populations spanning across 70 years of statistical activities. It covers displaced populations such as refugees, asylum-seekers, and internally displaced persons, including their demographics. This website is based on three data sources:
- UNHCR data collected through its annual statistical activities with some data going back as far as 1951, the year UNHCR was created.
- Data provided by the United Nations Relief and Works Agency for Palestine Refugees in the Near East (UNRWA).
- Data provided by the Internal Displacement Monitoring Centre (IDMC).
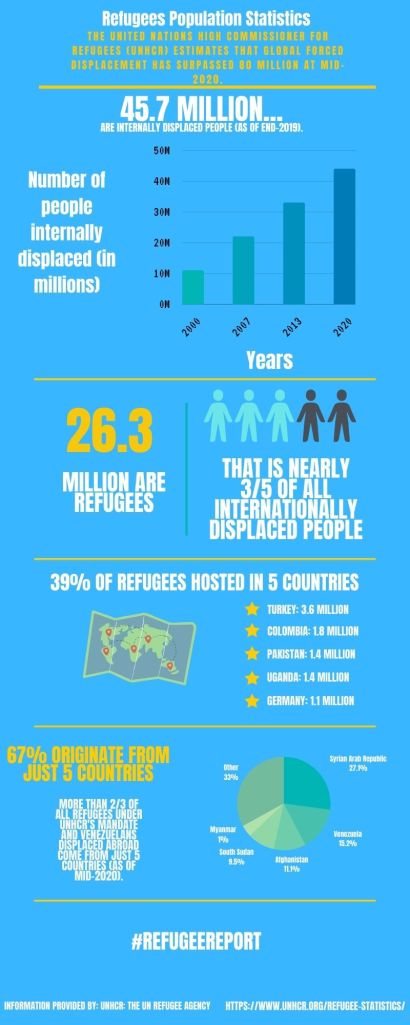
The UNHCR estimated that global forced displacement has surpassed 80 million at mid-2020. In my first graph, I state that 45.7 million people are internally displaced people as of mid-2019. In this bar graph, I present a y-axis of years (2000, 2007, 2013, 2020) and an x-axis of millions ( 0M, 10M, 20M, 30M, 40M, 50M). On average, for every 7 years, the amount of internally displaced people would increase by 11 million.

Next, I reported that 26.3 million people are refugees. That is almost 3 out of 5 of all internally displaced people. I highlighted this information with a giant “26.3 MILLION,” and added 5 human figures where 3 were shaded to emphasize how 60% are refugees.

Furthermore, I spotlighted how 39% of refugees are hosted by just countries: These nations and the approximate number of refugees are:
- Turkey with 3.6 million people.
- Colombia with 1.8 million people.
- Pakistan with 1.4 million people.
- Uganda with 1.4 million people.
- Germany with 1.1 million people.
These facts are bullet-pointed with a yellow star to emphasize their importance, and they are next to a map that details chosen locations of the world.

Additionally, I implemented information that states 67% originate from just 5 countries. It is crucial to list visible data that supports how more than 2/3 of all refugees under UNHCR’s mandate and others displaced abroad are just from 5 countries. To help with this, I created a pie chart to showcase the findings. The figures are presented as:
- Syrian Arab Republic: 27.1%
- Venezuela: 15.2%
- Afghanistan: 11.1%
- South Sudan: 9.5%
- Myanmar: 1%
- Other: 33%
Lastly, I generated a hashtag called #REFUGEEREPORT to underline the importance of internally displaced people and refugees in the world.

